Workspace panel kinds
A panel is one of the tool’s own views, so a panel and its full page show the same thing. This page says what each kind shows and how fresh it is.
My list, Movers, the Wire and the market pages
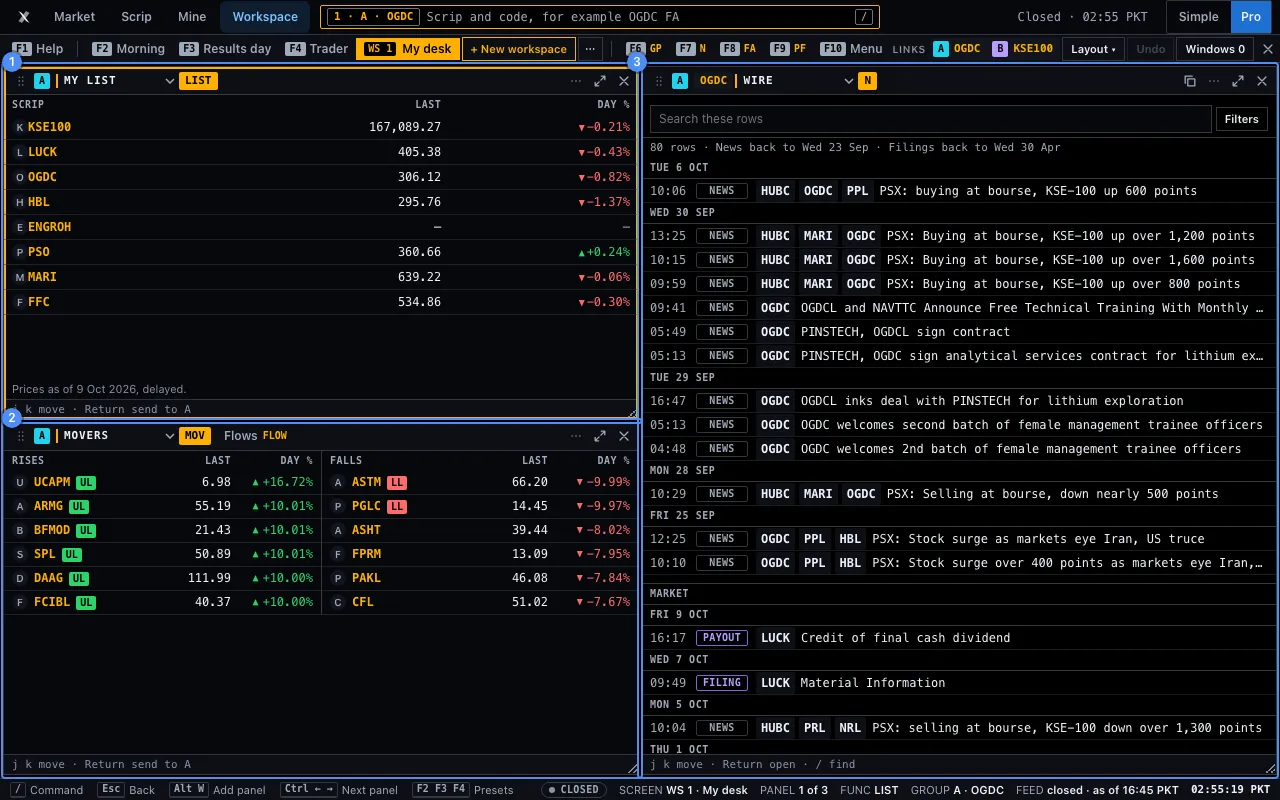
| Panel | Code | What it shows |
|---|---|---|
| My list 1 | LIST | The scrips of your watchlist with their last price and day change. It reads your device and sends nothing. Pressing a row sends that scrip to the panel’s link group. |
| Movers 2 | MOV | The rises and the falls of the day. A scrip at its upper or lower limit is tagged so. Pressing a row sends that scrip to its group. Its sibling is Flows FLOW. |
| Wire 3 | N | The exchange’s news and filings, newest first. With a scrip, only its rows. It has the search box, the type buttons and My list, My holdings and KSE-100 only filters. KSE-100 only keeps the rows that name a scrip of the KSE-100. It reads the index’s list when you first press it, and it is kept until you leave the Wire. |
| Heat map | HEAT | The market as a map: a block for each sector and a cell for each scrip in it. The area is the value traded, the colour is the day’s change, and each cell with room writes its code and its figure, so colour is never the only sign. Pressing a cell sends that scrip to the panel’s link group. It reads the same board as Movers and the table of sectors the app keeps for a day. It sends no new request. |
| Breadth | BRD | How many scrips are up, down and level, and the volume traded on each side, from the same board. |
| Calendar | CAL | The exchange’s next 14 days: open or closed, with the holiday’s name. Projected marks a day that no notice has settled yet. Typed alone, CAL opens the calendar of results and payouts on Home. |
| Flows | FLOW | The last published session’s net flow by investor type, in PKR millions, with its date. The clearing company publishes no flow for one scrip, so none is shown. |
| Economy | ECO | The policy rate, T-bill yields, USD/PKR and year-on-year CPI, each with its date. |
| Fixed income | FI | Government Ijara Sukuk auction results and the exchange’s list of government instruments. |
| Screener | SCR | The screener page in a panel. |
| Discover | DISC | The Discover page in a panel. |
Rows are 24 px high with tabular figures, so columns line up. A figure that is not published is a dash, never a zero. Economy, Fixed income, the Screener and Discover are the pages of the same names in a frame. Their own keys are on Codes and keys.
Chart, statements, results, facts, ownership and more
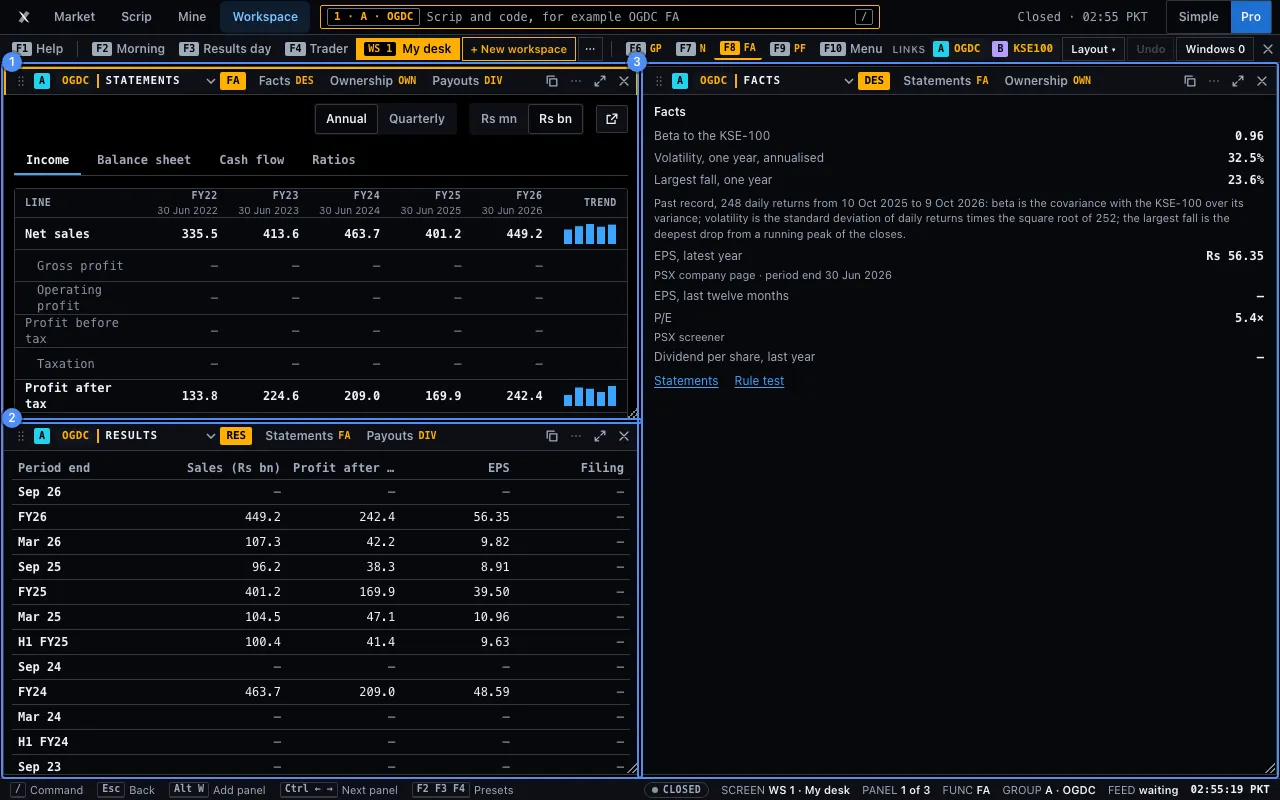
These panels follow a scrip: the link group’s, or their own when the panel has no group.
| Panel | Code | What it shows |
|---|---|---|
| Chart | GP | The chart, light or full. See the chart panel. |
| Statements 1 | FA | Income, Balance, Cash and Ratios for 5 years, annual or quarterly. A bracket is a negative figure. |
| Results 2 | RES | Period end, sales, profit after tax, EPS and a link to the filing. The next results window is the first row. |
| Payouts | DIV | Ex-date, type, amount per share, book closure and source. |
| Facts 3 | DES | Beta to the KSE-100, volatility, the largest fall in a year, EPS, P/E and the dividend per share. |
| Ownership | OWN | Free float, shares in the depository, margin trading and lending, each with who published it and the date. |
| Analysis | ANA | Returns against the sector and the index, key figures against the sector’s median, filed results, dividends and ownership. |
| Rule test | BT | A rule tested against the scrip’s past bars and compared with staying in for the same period. Run on also tests it on My list, KSE-100 or KMI-30: one row a scrip, 100 scrips at most. |
| Time and sales | TAS | The latest trades. See [Time and sales](#tas). |
| Peers | PEER | The scrip beside the 8 largest scrips of its sector: P/E, yield, market cap, 52-week position and the value, growth and profit grades, each column dated. A median row leaves out a blank. The grades are the screener’s A to F; they are not advice. |
| Candle shapes | PAT | The candle shapes of the newest 250 sessions and the dates where the mean daily change shifted, newest first, each with the label the backend serves. A shape’s sign, upward or downward, is a convention for how it is drawn, not a call on what follows. They are worked out once a night after the close, so a scrip shows Computed after the close; first run tonight until its first run. The chart’s Candle shapes and trend breaks layer in Pro’s Layers panel marks the same dates. |
| Seasonality | SEAS | The mean change by calendar month and by weekday, each bucket with the number of observations behind it. A bucket with fewer than the minimum sample (5 for a month, 100 for a weekday) shows no mean, only how many it has of how many are needed. Past changes, not a view on the next one. |
| Ask | ASK | A question about the scrip, answered by the Vault. A line that ends in a question mark opens it with the scrip and asks at once: OGDC why did it fall? (the scrip first, in capitals) or why did it fall? for the scrip in the focused panel. Every question is sent to the Vault, which answers from its pages. The panel shows what the Vault serves, and every answer lists its sources or says it has none. The question stays in the page and is not in the address. |
| Discounted cash flow | DCF | On request only. It shows the not-advice line first, then reads the scrip’s statements when you press the button. You type the growth, the discount rate, the growth after year 5 and the net debt. It gives the value under those assumptions, a 5 by 5 grid around them, and the growth today’s price goes with. A bank shows Not for banks, and a scrip with under 3 years of cash flow shows a line and no figure. A missing line shows “—” and you may type it. |
| Director dealings | INS | The notices the exchange filed for the scrip under rule 5.6.1(d), newest first, each with its date, title and link. The title is the exchange’s, and no direction of the trade is stated. With no scrip on screen, INS goes to the market’s list on Home. |
The panel’s head ends with a link to the scrip’s company page on superx.pk. With no scrip, a panel says so and shows nothing made up. Sibling buttons move between Statements, Facts, Ownership and Payouts in the same panel.
Portfolio, My holding and risk
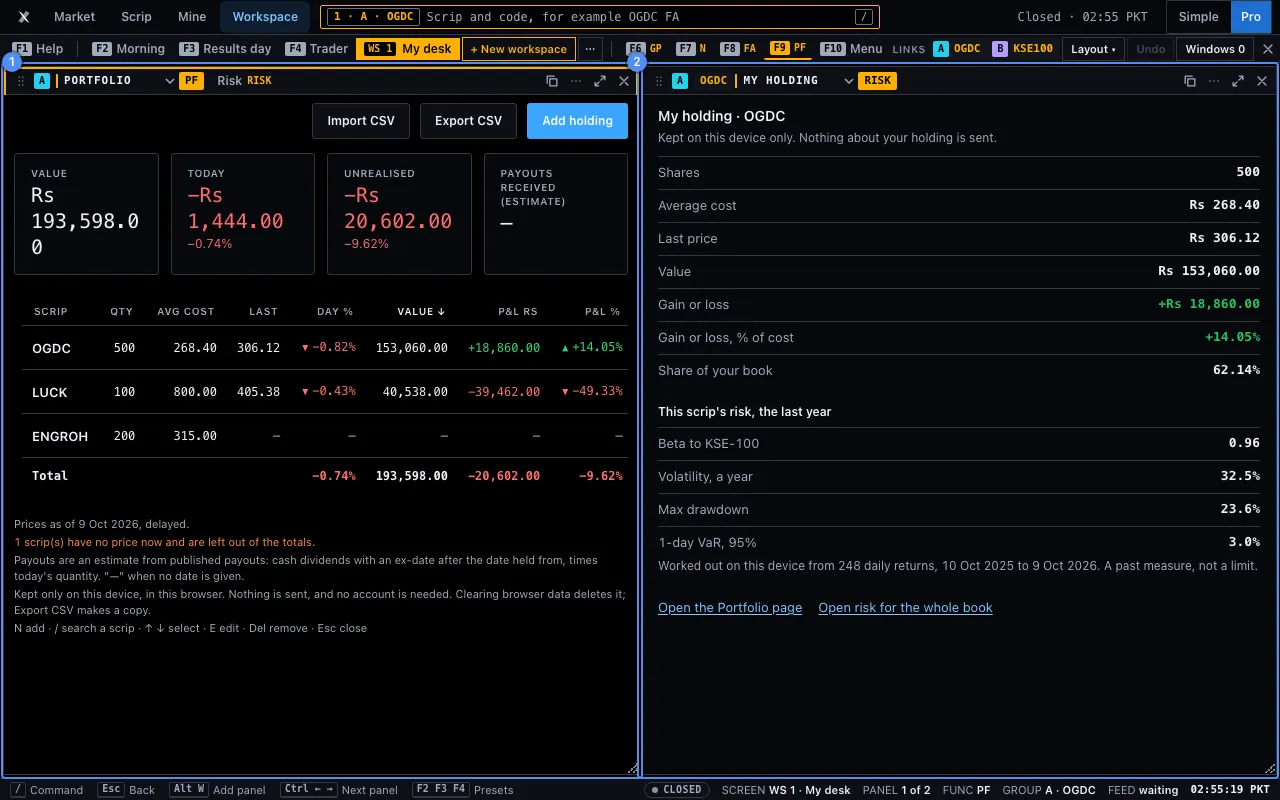
Holdings stay on this device. The portfolio reads them here and works them out here. Nothing is sent. No link, share card, layout file or window link carries them.
| Panel | Code | What it shows |
|---|---|---|
| Portfolio 1 | PF | The holdings you typed in: the value of each and of the whole, the day’s change, and the gain or loss against cost. Pressing a row sends the scrip to its group. |
| My holding 2 | RISK | With a scrip, that scrip’s shares in the portfolio on this device: shares, average cost, last price, value, gain or loss, its share of the book, and its risk over the last year. With none, it says so and links to the portfolio. |
| Portfolio mixes | OPT | Three worked mixes of the portfolio, or of My list, from past prices over 3 months, 1 year or 3 years: the lowest-variance mix, the equal-risk mix and the highest-return-per-risk mix. It opens with one line and one button, Work out the mixes, and reads nothing until you press it. It shows the weights next to your current ones, the volatility and return of each mix, and a chart of 20 mixes that lie on the frontier. It is a frame of the page #go=OPT. |
Two more functions of the book open as pages over Home, in the address #go=PF+RISK and #go=CORR. They are not panel kinds.
RISKalone is the risk of the portfolio: the value at risk, the shortfall (ES, the average of the losses beyond the value at risk), the Sharpe ratio, the beta to the KSE-100 and the largest drawdown, over 3 months, 1 year or 3 years.CORRis the correlation matrix of the scrips you hold: how they moved together.
OPT is a worked mix, not a suggestion. A mix is a description of what past prices say about a set of scrips under one rule: no weight is under 0, the weights add to 100.00%, and no scrip is above the cap you set, 40% at first. It is not financial advice, past returns do not repeat, and you decide. The holdings, the weights and the cap stay on this device. The page asks only for public price history and the 3-month T-bill rate, and it keeps one setting, the rule, the window and the cap. The window it prints is the one it used, from a date to a date; it is shorter than your setting when one scrip has less history, and the page names that scrip. When no mix returned more than the T-bill rate, the highest-return-per-risk mix is not shown and the page says why. The solve runs in the background, so the page stays usable while it works.
The device computes every figure from the price history it already holds. A figure with too little history says so, instead of showing a guess.
Time and sales (TAS)
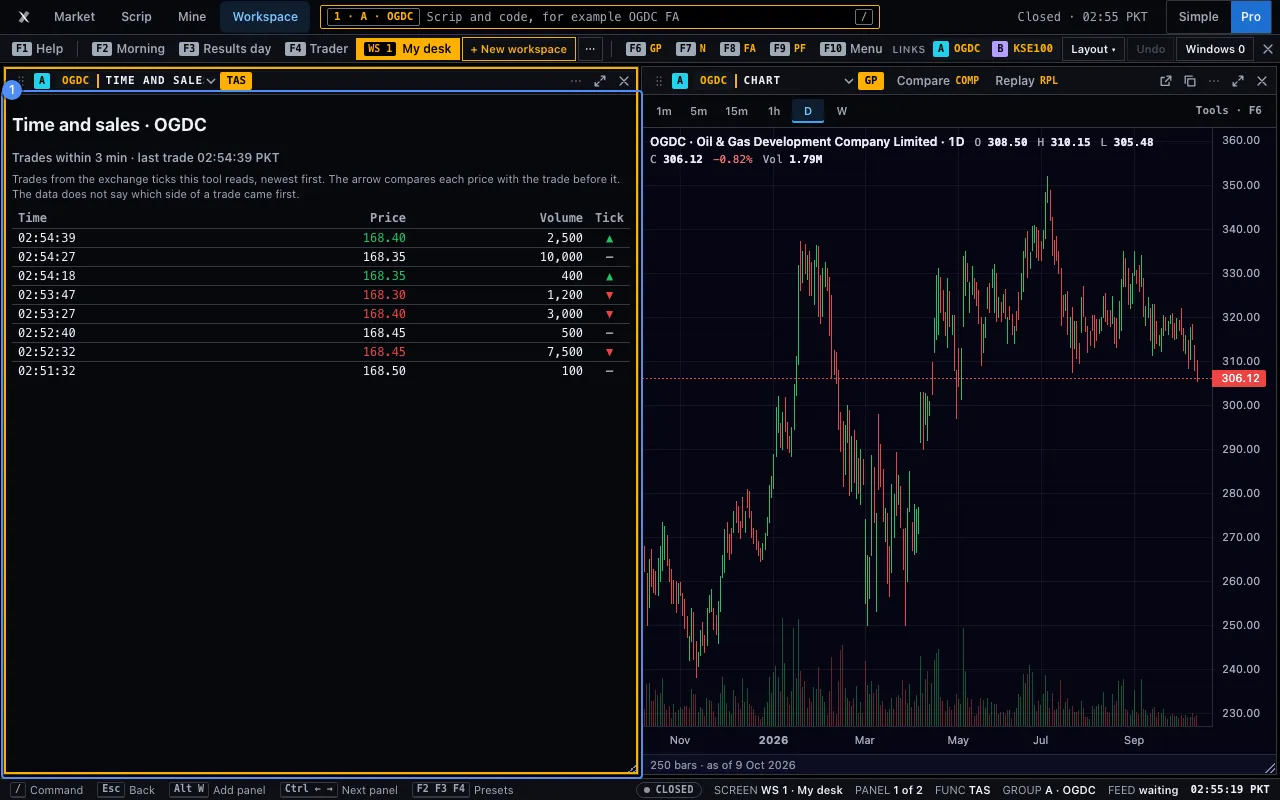
OGDC TAS shows the latest trades the tool holds, newest first. Each row has the time in Karachi, the price, the volume and an arrow.
- The line above the rows 1 says how fresh they are, such as Trades within 3 min or 15–20 min behind. It never says LIVE.
- The arrow 2 is a price comparison: ▲ means this trade’s price is above the trade before it, ▼ below it, and a dash the same. It is not a buyer or a seller side. The data does not say which side of a trade came first, so no side is shown.
- A panel with no trades says so in a line.
DEPTH, the order book, is not built yet. Its Depth tile says “Coming: the order book waits for the exchange’s depth feed.” The table of codes shows Coming too. Neither shows a figure.
How fresh is the data?
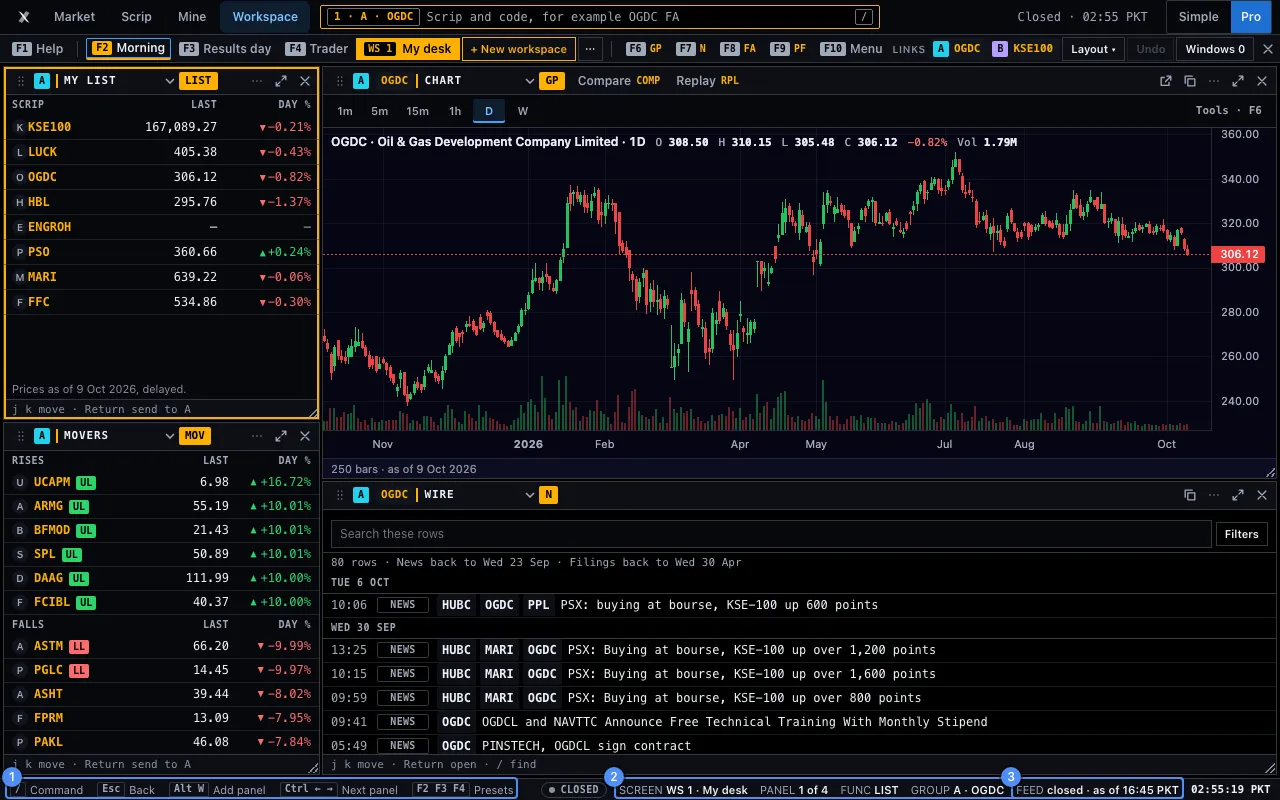
Every panel reads the same data as its full page, at the same cadence. The tool never shows delayed data without a label.
- The FEED field 1 says the state of the board in a word, with its age. See the status line.
- A panel with its own age 2 says so: Time and sales, the Wire’s N new bar, a result’s date, an economy tile’s date and source.
- The cadence line in the status line says how often the data refreshes, in the tool’s own words.
- When the session is closed, the last figures stand and the field says closed.
- A figure the record does not have is a dash with its reason, never a zero and never filled in.
The Wire checks for new rows every 5 minutes while its tab is on screen. A tab that is not on screen asks for nothing. The list never moves by itself: press the bar to show new rows.
On a chart, the ▲ and ▼ marks beside a price compare it with the one before. They do not say who traded.