Indicators
Indicators are lines and panes computed from the bars. Simple has four presets. Pro has the whole catalogue.
Simple’s presets

- Open the indicators menu 1 in the top bar.
- Choose Price only, Moving averages 20 / 50, RSI 14 or Bollinger Bands.
Volume is on every preset. Every other indicator is in Pro.
Choose an indicator

- In Pro, click Indicators or press I.
- Type a name in the search 1, for example “macd” or “bollinger”.
- Click a row of the list 2. The indicator appears on the chart.
- Click a row’s star to make it a favourite.
The families show how many indicators each holds.
Change and remove an indicator
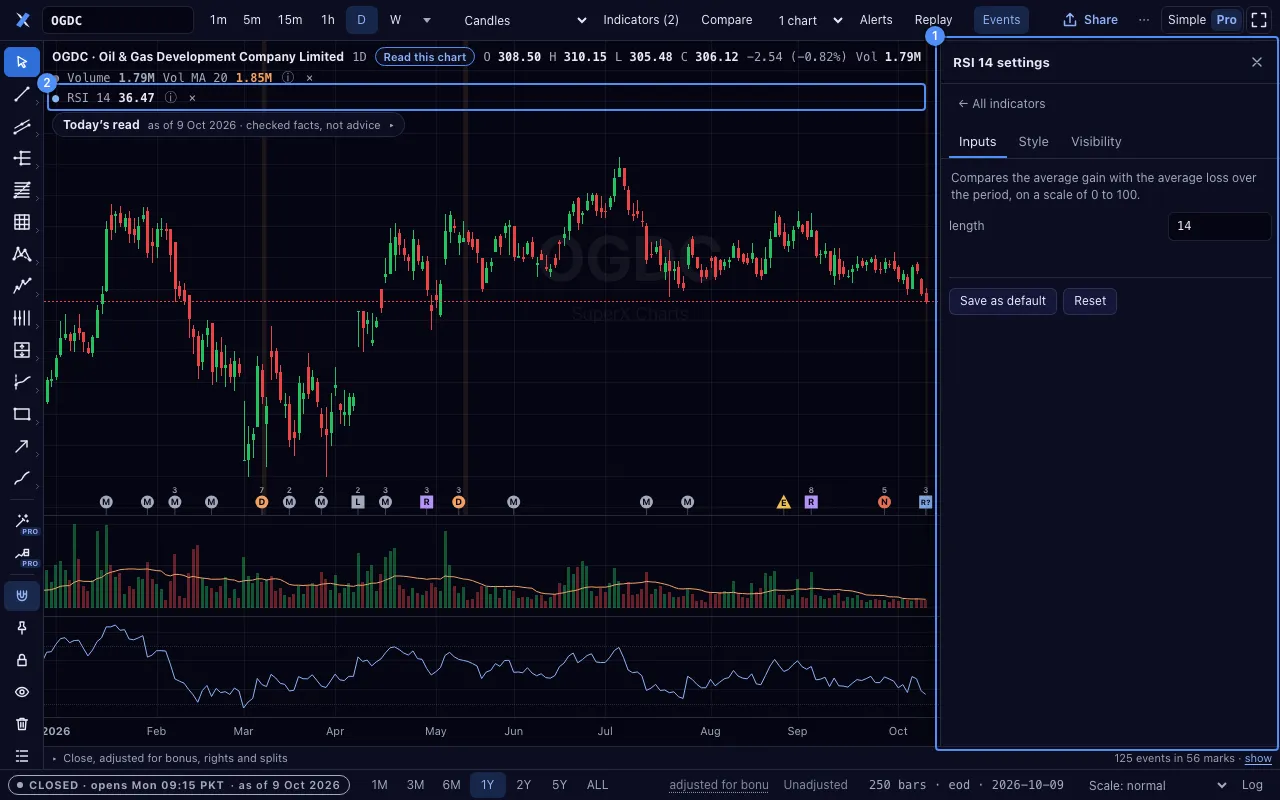
- Find the indicator’s row in the legend 2.
- Open its settings 1: Inputs, Style and Visibility.
- Change a value. The chart draws it again at once.
- Save as default stores your values for the next time. Reset goes back to the indicator’s own values.
- Click × on the row to remove the indicator.
On a phone, tap ▾ in the legend to open the rows.
A right-click on a row offers Explain this indicator: a short card on how it works.
The catalogue
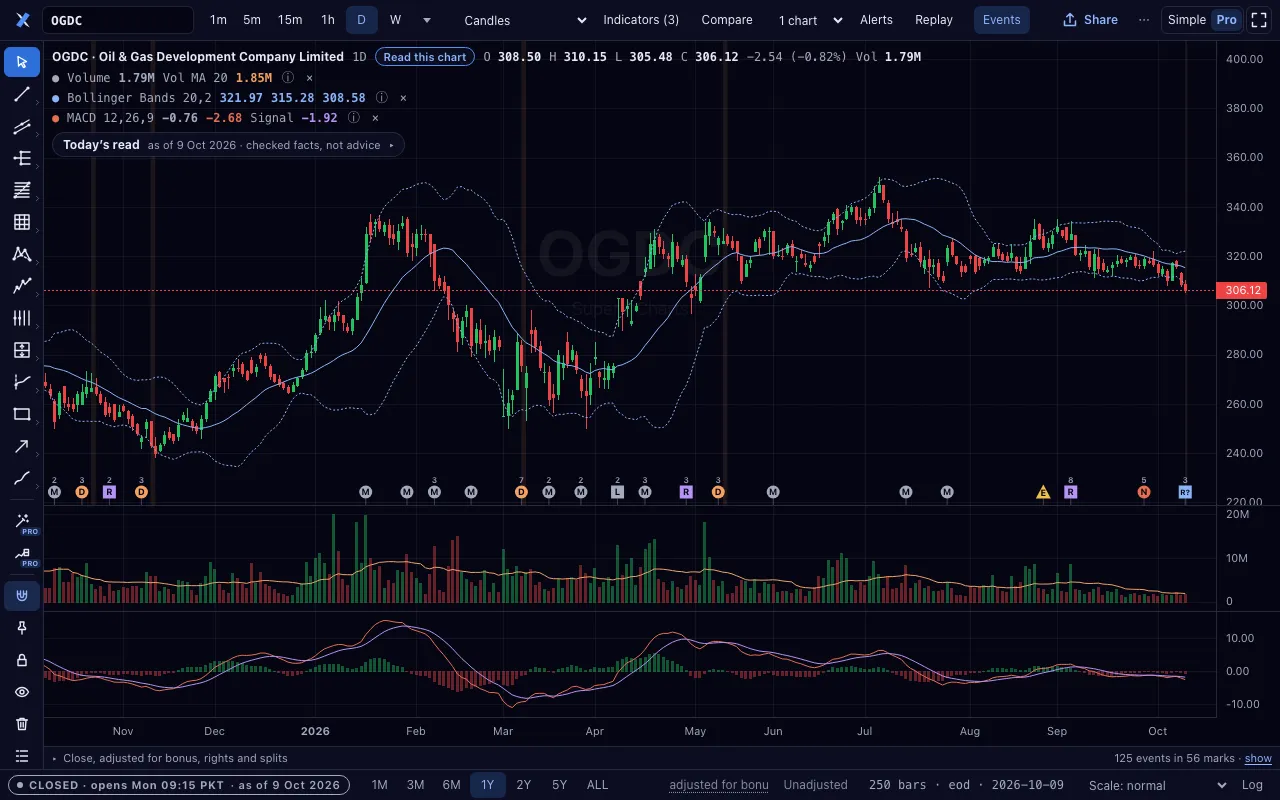
Every indicator, by family. 30 of them are checked against the open library pandas-ta on five PSX price series.
| Family | Indicators |
|---|---|
| Moving averages (12) | Moving average (SMA), Exponential MA (EMA), Weighted MA (WMA), Volume-weighted MA, Hull moving average (HMA), Double exponential MA (DEMA), Triple exponential MA (TEMA), Wilder's moving average (RMA / SMMA), Kaufman adaptive MA (KAMA), Arnaud Legoux MA (ALMA), Least squares MA (LSMA), McGinley Dynamic |
| Bands, channels and levels (16) | Bollinger Bands, Donchian Channel, Keltner Channel, Pivot points (classic), Bollinger %B, Bollinger bandwidth, Envelopes, Price channel, Chande Kroll stop, Williams Alligator, Williams fractals, Pivot points (Fibonacci), Pivot points (Camarilla), Pivot points (Woodie), Pivot points (DeMark), ZigZag |
| Trend (8) | Ichimoku Cloud, Parabolic SAR, Supertrend, ADX / DMI, Aroon, Vortex indicator, Choppiness index, Linear regression curve |
| Momentum (22) | RSI, MACD, Stochastic, CCI, Williams %R, Rate of change, Momentum, TRIX, Stochastic RSI, Percentage price oscillator (PPO), True strength index (TSI), Ultimate oscillator, Awesome oscillator, Chande momentum oscillator (CMO), Coppock curve, Detrended price oscillator (DPO), Know sure thing (KST), Fisher transform, Stochastic momentum index (Blau SMI), Connors RSI, Relative vigor index (RVI), Balance of power (BOP) |
| Volatility (6) | ATR, Mass index, Historical volatility, Ulcer index, Standard error bands, Average day range |
| Volume (15) | Volume, VWAP (per session), On-balance volume, Money Flow Index, Volume profile (visible range), Chaikin Money Flow, Accumulation/distribution, Chaikin oscillator, Klinger oscillator, Price-volume trend, Ease of movement, Volume oscillator, Relative volume, Elder ray, Force index |
| Against the market (2) | Relative strength vs benchmark, Correlation coefficient |
| Fundamentals and total return (9) | Total return (dividends reinvested), EPS (annual), Revenue (annual), Net margin (annual), Dividends per share (trailing 12 months), Payout ratio (trailing dividends ÷ annual EPS), P/E (price ÷ annual EPS), Dividend yield (trailing 12 months), P/E bands (price at 5, 10 and 15 × annual EPS) |
Studies on studies, and other timeframes

An indicator reads the price, another indicator, or the bars of a longer interval.
sma:20>rsi:14in the link draws the 20-bar average of RSI 14. A chain is at most four deep.rsi:14@1wdraws a weekly RSI on a daily chart. It reads no bar from after the day it stands on.
Your own formula

- In the Indicators panel, open Formula.
- Write a formula, for example
close / close(KSE100). - Draw it. A formula in price units draws on the price. Any other gets a pane of its own.
| Write | Meaning |
|---|---|
close open high low volume | this chart’s bars |
close(PPL) | another symbol, matched by date |
+ - * / and brackets | arithmetic |
> < >= <= == !=, and or not | conditions: 1 when true, 0 when false |
sma ema rma wma(x, n) | averages of any series |
highest lowest(x, n) | the highest or lowest of the last n values |
ref(x, n) | x, n bars ago |
crossover crossunder cross(a, b) | a crosses b |
rsi(14), hma(21) | an indicator of the catalogue |
macd(12, 26, 9).signal | a named line of an indicator |
Gaps are never filled. A formula has at most 500 characters. It runs apart from the page, with no network.
The link carries the formula, so a shared chart shows it too.