PSX · SUGAR & ALLIED INDUSTRIES
FRSM Faran Sugar Mills
FRSM closed at Rs 40.57 on 20 Oct 2026: 0.00% on the day, −28.6% over one year.
Open the chart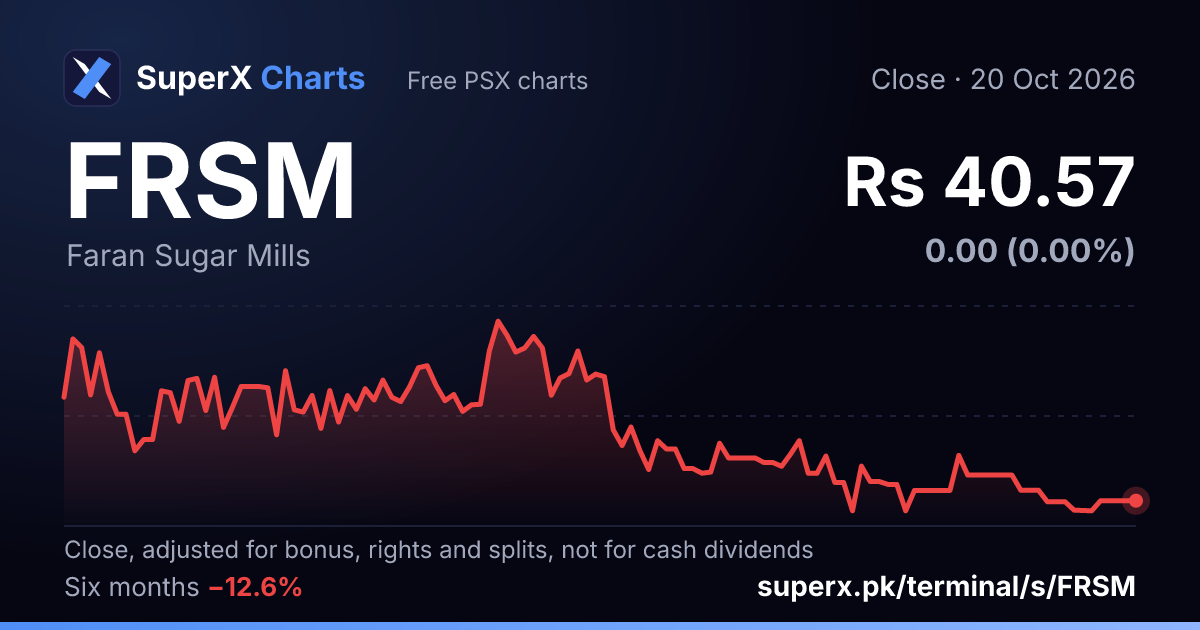
FRSM technical readings
From daily closes to , close Rs 40.57. Measurements, not advice.
- 14-day RSI: 42.8 on a 0–100 scale
- 50-day average close: Rs 41.67 · the close is 2.6% below it
- 200-day average close: Rs 46.12 · the close is 12.0% below it
- 52-week range: Rs 34.22 – Rs 63.20 · the close is 22% of the way up
FRSM monthly closes
Last close of each month, to .
- Nov 2025 Rs 53.24 −3.0%
- Dec 2025 Rs 54.00 +1.4%
- Jan 2026 Rs 52.07 −3.6%
- Feb 2026 Rs 41.02 −21.2%
- Mar 2026 Rs 43.01 +4.9%
- Apr 2026 Rs 43.38 +0.9%
- May 2026 Rs 47.89 +10.4%
- Jun 2026 Rs 45.60 −4.8%
- Jul 2026 Rs 43.49 −4.6%
- Aug 2026 Rs 41.60 −4.3%
- Sep 2026 Rs 41.16 −1.1%
- Oct 2026 Rs 40.57 −1.4%
Recent explained moves
- +4.79%
Up 4.8% on thin volume (0.2× usual), gapping 3.9% at the open. The KSE-100 moved +1.1% the same day. - −3.59%
Down 3.6% on thin volume (0.2× usual). The sugar & allied industries sector moved the same way, median -1.0% (18 of 29 names down). The KSE-100 moved -1.8% the same day. - +6.30%
Up 6.3% on 20.6× the usual volume. About 2.5× this name's usual daily move. - −3.85%
Down 3.8% on 4.4× the usual volume. - −3.44%
Down 3.4% on 1.0× the usual volume, gapping 2.3% at the open. Foreign investors were net sellers of Rs 1,048M across the market. No filing, sector move or volume behind it in the data.