PSX · CHEMICAL
GGL Ghani Global Holdings
GGL closed at Rs 19.34 on 20 Oct 2026: −0.77% on the day, −26.2% over one year.
Open the chart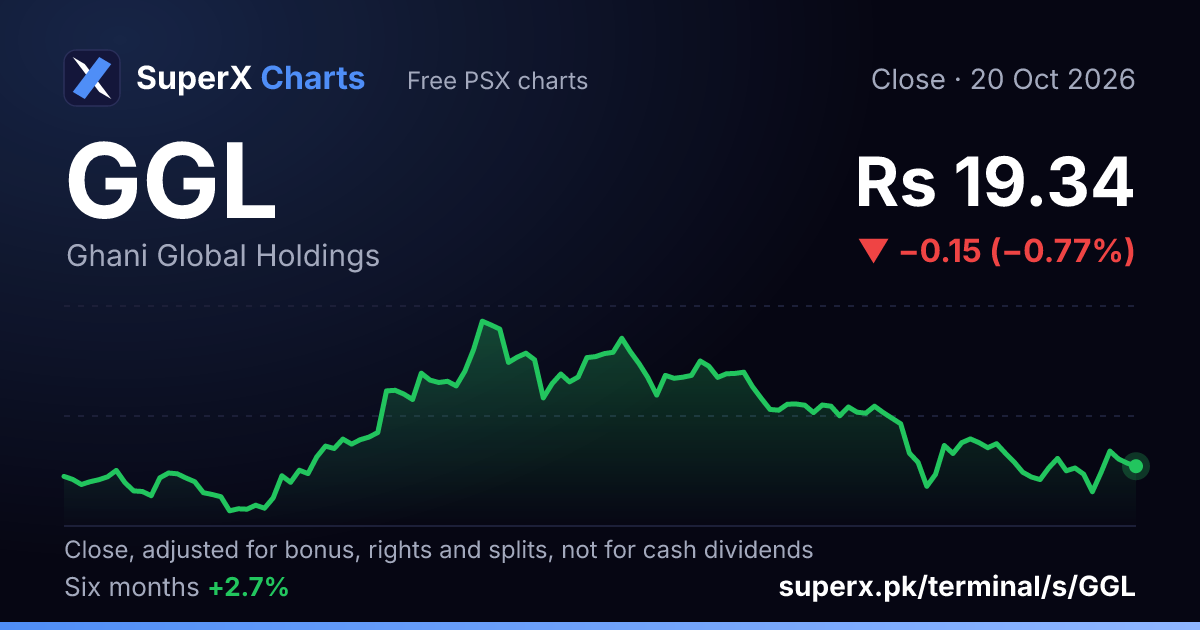
GGL technical readings
From daily closes to , close Rs 19.34. Measurements, not advice.
- 14-day RSI: 45.8 on a 0–100 scale
- 50-day average close: Rs 20.97 · the close is 7.8% below it
- 200-day average close: Rs 20.91 · the close is 7.5% below it
- 52-week range: Rs 14.10 – Rs 28.75 · the close is 36% of the way up
GGL monthly closes
Last close of each month, to .
- Nov 2025 Rs 25.91 +4.6%
- Dec 2025 Rs 25.49 −1.6%
- Jan 2026 Rs 23.26 −8.7%
- Feb 2026 Rs 17.93 −22.9%
- Mar 2026 Rs 14.88 −17.0%
- Apr 2026 Rs 18.10 +21.6%
- May 2026 Rs 18.86 +4.2%
- Jun 2026 Rs 23.37 +23.9%
- Jul 2026 Rs 22.91 −2.0%
- Aug 2026 Rs 22.41 −2.2%
- Sep 2026 Rs 19.56 −12.7%
- Oct 2026 Rs 19.34 −1.1%
Recent explained moves
- +5.62%
Up 5.6% on 2.0× the usual volume. - +5.37%
Up 5.4% on 0.8× the usual volume. No filing, sector move or volume behind it in the data. - −4.65%
Down 4.6% on 1.0× the usual volume. No filing, sector move or volume behind it in the data. - −3.14%
Down 3.1% on thin volume (0.4× usual). Material information was filed within the last two sessions. - +3.16%
Up 3.2% on thin volume (0.3× usual). The chemical sector moved the same way, median +1.0% (20 of 26 names up). The KSE-100 moved +1.6% the same day. A board meeting was notified within the last two sessions.