PSX · TEXTILE SPINNING · Explained move
D.S. Industries
On 23 Oct 2026, DSIL rose 10.02% to close at Rs 30.75, on 0.41× its 20-day average volume. It opened 3.40% below the previous close. Its sector's median name was unchanged. The KSE-100 fell 0.95% the same day. Across the market, foreign investors sold a net Rs 416.57M, which local investors bought. The move was 1.60× the stock's usual daily move. It closed at a new 52-week high. Exchange notices in the last two sessions: board meeting. It closed at the exchange's price limit for the day.
Open the chart on 23 Oct 2026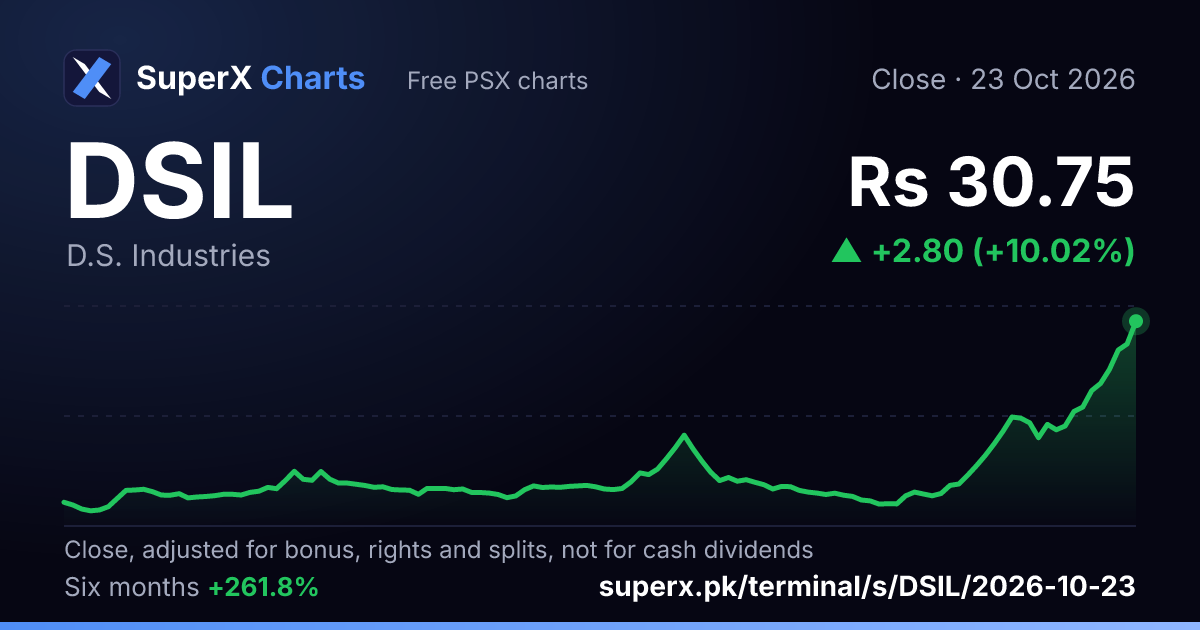
The day's numbers
- Close
- Rs 30.75
- Change on the day
- +10.02%
- Gap at the open
- −3.40%
- Shares traded
- 4,337,746
- Volume against its 20-day average
- 0.41×
- KSE-100 the same day
- −0.95%
The record's sentence
DSIL closed up 10.0% at Rs 30.75 while the KSE-100 fell 0.9%. Its sector's typical stock was flat: 16 rose and 18 fell. So DSIL rose on its own. That is the most the exchange allows in one day. 4.3 million shares traded, 0.4 times a normal day.
Source: the explained-move record for the session of 23 Oct 2026, written 24 Oct 2026.
Facts from the exchange. Not advice.