PSX · INV. BANKS / INV. COS. / SECURITIES COS. · Explained move
MCB Investment Management Limited.
On 23 Oct 2026, MCBIM fell 7.85% to close at Rs 126.24, on 19.03× its 20-day average volume. It opened 3.65% above the previous close. Its sector moved the same way: the median name fell 0.89%, and 21 of 34 names were down. The KSE-100 fell 0.95% the same day. Across the market, foreign investors sold a net Rs 416.57M, which local investors bought. The move was 4.80× the stock's usual daily move. It closed at a new 52-week low.
Open the chart on 23 Oct 2026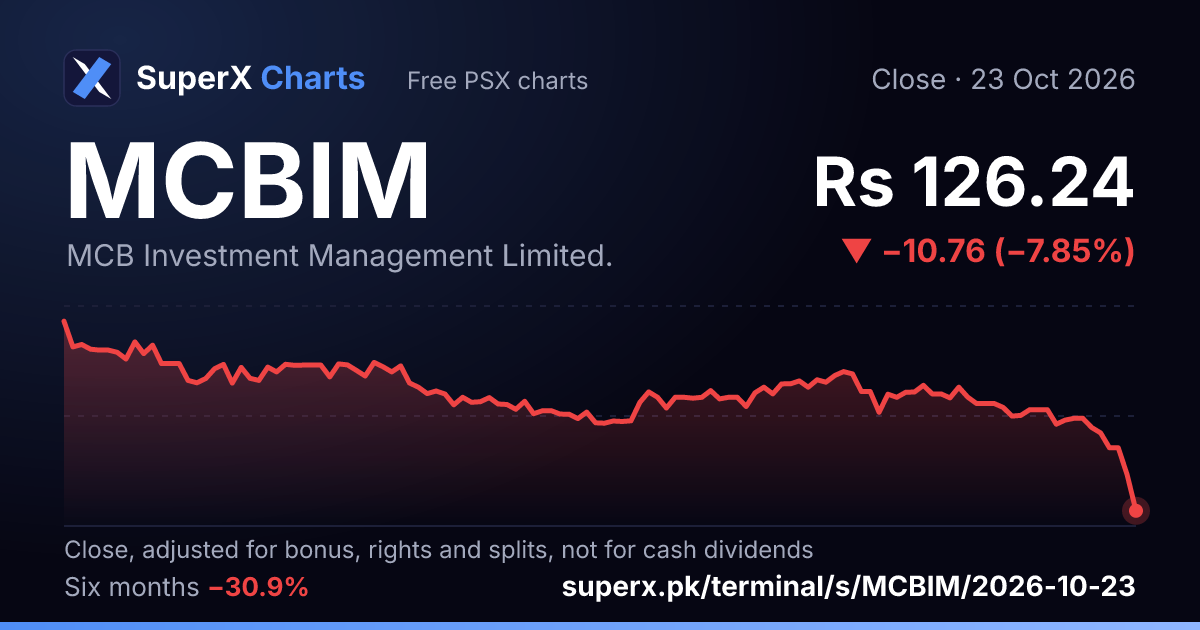
The day's numbers
- Close
- Rs 126.24
- Change on the day
- −7.85%
- Gap at the open
- +3.65%
- Shares traded
- 50,042
- Volume against its 20-day average
- 19.03×
- KSE-100 the same day
- −0.95%
The record's sentence
MCBIM closed down 7.8% at Rs 126.24. Its sector's typical stock fell 0.9%; the KSE-100 fell 0.9%. So this was MCBIM's own move. 50,042 shares traded, 19.0 times a normal day. MCBIM filed nothing that moves a price, that session or the day before.
Source: the explained-move record for the session of 23 Oct 2026, written 24 Oct 2026.
Facts from the exchange. Not advice.